Exercise: Two-population testing flowchart
Objective
Once, I was planning to just draw this flowchart on the board. I am really glad that I instead gave it as an exercise, because it prompted a lot of discussion and I think it really helped put the past week of lectures into a big picture. It also seemed to help convince the students that the permutation test is worth remembering. I emphasized that the permutation test could be used at the end of every branch of the flowchart, while the t-tests require careful thought about their assumptions.
This exercise also seemed to cause the students to think about the central limit theorem for the first time. I mean, I had lectured on the subject. And yet, I had to prompt every group before they were able to say that the CLT allows us to assume that the sample mean of non-normal data is normal if the sample size is large.
This was certainly the best exercise I assigned this week. I followed up by teaching the details of the Welch test, which I had only mentioned previously.
Exercise
As a group, draw a flowchart that will describe which hypothesis test to use. You may assume that you are testing the following null hypothesis for two populations, X and Y:
Here is the list of branches for the flowchart, in no particular order:
- Are the population variances equal?
- Is the sample size “large”?
- Are the data approximately Normal?
And here are the tests that form the ends of branches on the flowchart:
- Permutation test
- Pooled variance t-test
- Welch t-test
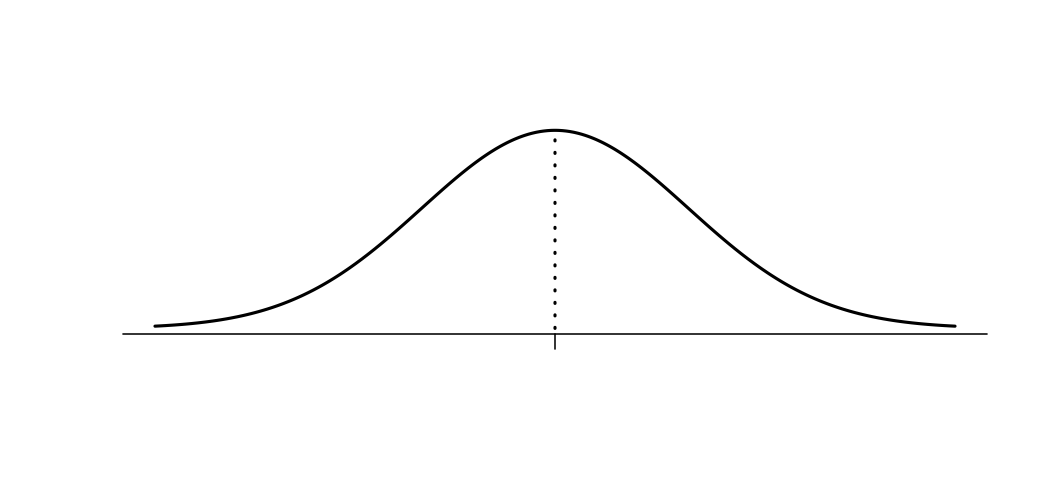
Finally, suppose that you’re using one of the t-tests for some data. The observed t-statistic is 1.21, degrees of freedom are 13, and the density of a standard $t_{13}$ distribution is sketched below. Find the p-value and shade the appropriate area under the curve.