Exercise: Bootstrap and engine block data
Objective
Today’s exercise is about the bootstrap. I had been warned by a previous instructor that the sudents often get confused about the bootstrap, thinking that adding more resamples will cause the central limit theorem to kick in, or something.
The discussion went well - I was able to draw out and then correct some of these misconceptions. In case you run this exercise, here are some things my students said, that you should watch out for:
- Generating more bootstraps causes the histogram to get narrower.
- Generating more bootstraps causes the distribution to become Normal (though in my case the data were normal. I probably should have avoided that.)
- Increasing the size of each bootstrap causes the histogram to cluster more tightly around the population expectation.
- The distribution gets better when the sample size is increased within each bootstrap because the histogram becomes narrower.
Happily, by the time we got to discussing question 3, they all seemed to grasp that the way to make your bootstrap confidence interval narrower is to include more data in the original sample.
Exercise
Overview
We saw this data last week. A factory manufactures engine blocks for cars, and the last step of the process is to paint the blocks. It is important that the paint be thick enough to withstand high heat without cracking. The plant engineer wants to know how thickly, on average, the paint is being applied on blocks that leave the factory. He has collected a random sample of 16 engine blocks. The paint thicknesses on these were:
(A Q-Q plot is on the back). For these data, we have ${\bar X} = 1.35$ and $S = 0.339$.
Question 1
How might you find the confidence interval for the population mean of paint thickness? What distribution would you assume for the sample mean?
Question 2
A bootstrap approach was used to simulate the distribution of the sample mean. With $B=1000$, $B$ independent resamples of size $N=16$ were drawn (with replacement) from the original data. Then the mean of each resample was calculated. The histogram of these resampled means is below.
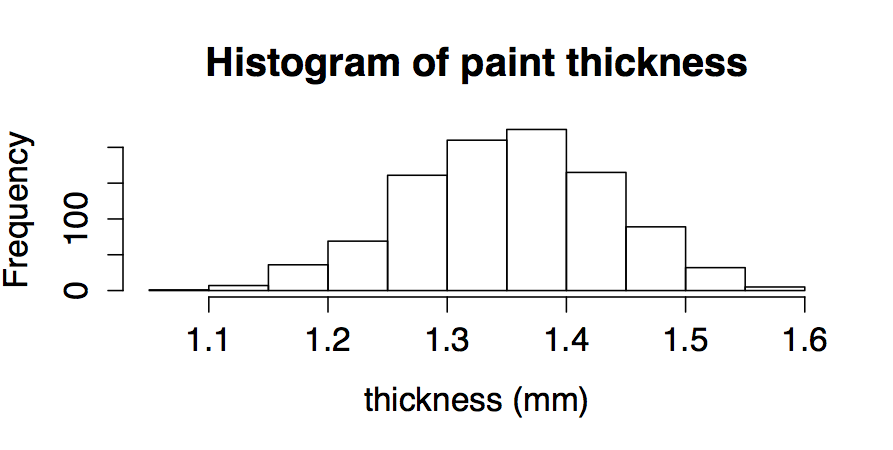
- How would the histogram change if we drew more bootstraps (increased B)?
- How would the histogram change if each bootstrap drew 32 samples with replacement, instead of 16 (increased N)?
Question 3
Following up on question 2, how can we get a bootstrap distribution that’s more clustered around the population mean (expectation)?
