Exercise: Hypothesis testing concepts
Objective
We are beginning our discussion of hypothesis testing. This exercise is designed to remind the students of some concepts that they already know, which will come in handy soon.
The first question should be straightforward. However, a lot of groups preferred not to think before writing something like
They had to be gently reminded that the data really ought to appear somewhere in the probability statement.
The second question is intended to be challenging and provocative. I had to help most groups to figure it out, but one group did surprise me by answering “The population that governs the probability is a t-distribution. It is a model for the distribution of the sample mean, centered around ${\bar y}$, and is our assumption about the shape of the distribution of the sample mean.” I thought that was nearly perfect.
Exercise
Question 1
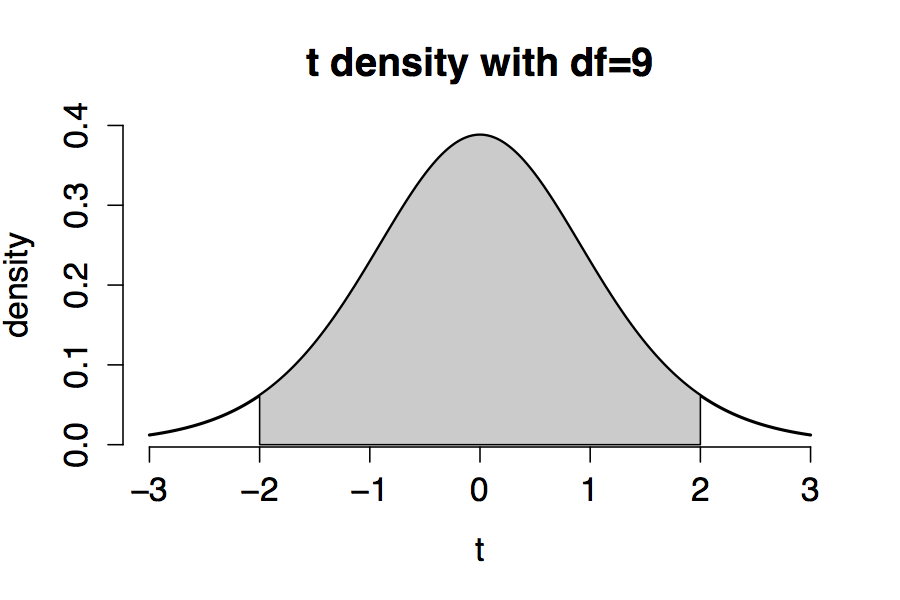
When calculating confidence intervals we’ve generated a lot of sketches like this one. Suppose that $Y_1, \dots, Y_{10}$ are i.i.d. random variables with expectation $\mu$ and variance $\sigma^2$ (both unknown).
We measure data $y_1, \dots, y_{10}$, compute their mean ${\bar y}$, and variance $s^2$. Then we compute a confidence interval for $\mu$, which is partly summarized by the plot.
- Write down the probability statement that’s summarized by the plot, given that the probability mass between -2 and 2 is 0.923.
Question 2
The previous question results in a probability statement. Recall that probability goes from population to sample, while inference goes from sample to population.
- What is the population that governs the probability above? Hint: random variables are models for a population.