Exercise: Prediction in a linear model
Objective
Students were supposed to recognize that variability of fitted values is about uncertainty in where to draw the regression line, while variability in prediction adds the noisiness of data being distributed around the line.
I also chose to emphasize that the linear model has lower variance nearer to the mean of covariate values, which was apparently counterintuitive. We took a long time on this exercise because the students had a hard time figuring out where to start.
Exercise
Setup
You’ve fitted a linear model to the data that relates car weight to fuel efficiency. The following are the summary from R’s lm function, and a plot of the model is on the back:
Coefficients:
            Estimate Std. Error t value Pr(>|t|)
(Intercept)  37.2851     1.8776  19.858  < 2e-16 ***
wt           -5.3445     0.5591  -9.559 1.29e-10 ***
---
Signif. codes:  0 ‘***’ 0.001 ‘**’ 0.01 ‘*’ 0.05 ‘.’ 0.1 ‘ ’ 1

Residual standard error: 3.046 on 30 degrees of freedom
Multiple R-squared:  0.7528,	Adjusted R-squared:  0.7446
F-statistic: 91.38 on 1 and 30 DF,  p-value: 1.294e-10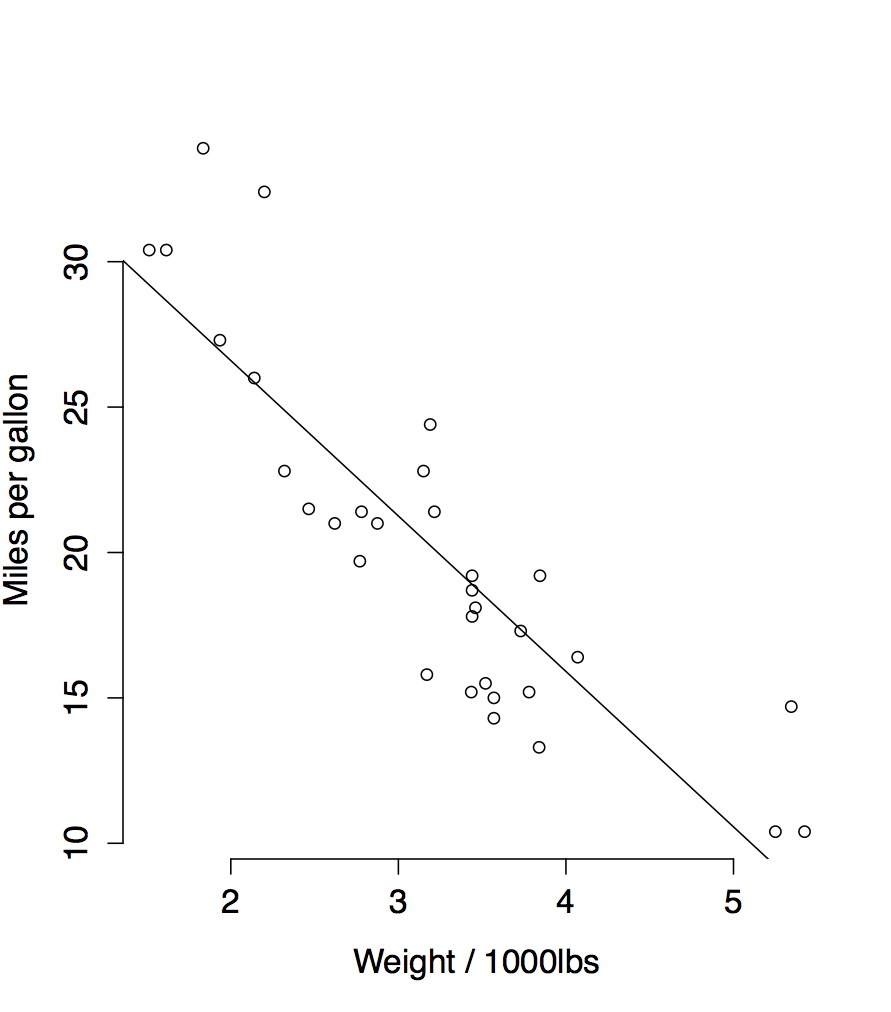
Questions
-
The Toyota Corolla has a weight of 1835 pounds, and a fitted value of 27.5 mpg. If possible, estimate the variance of the fitted value. Otherwise, identify the sources of variability in the fitted value for the Corolla.
-
A new car is being designed with a weight of 2000 pounds. Predict the fuel efficiency of the new car. If possible, estimate the variance of the predicted fuel efficiency of this new car. Otherwise, identify the sources of variability for the prediction.