Exercise: Estimating a linear model
Objective
This exercise was intended to show students that linear regression is comprehensible and intuitive. They mostly came up with very similar solutions. With a little prompting, every group eventually said that they would summarize their model by the slope and intercept.
A couple of groups got the influence question right, and they had different approaches for it. One noted that there are more dots below the best-fit line than above, and that the dots abover were toward the ends while the dots below were in the center. They concluded that the dots above the regression line must have greater weight to “balance” the dots below the regression line.
Another group noted that a small change to slope would affect the fit to observations far from ${\bar X}$ more than those near to ${\bar X}$, and concluded that those observations have more influence.
Exercise
Setup
Suppose you’re working on a car design and need to study the relationship between car weight and fuel efficiency. You have produced the following plot:
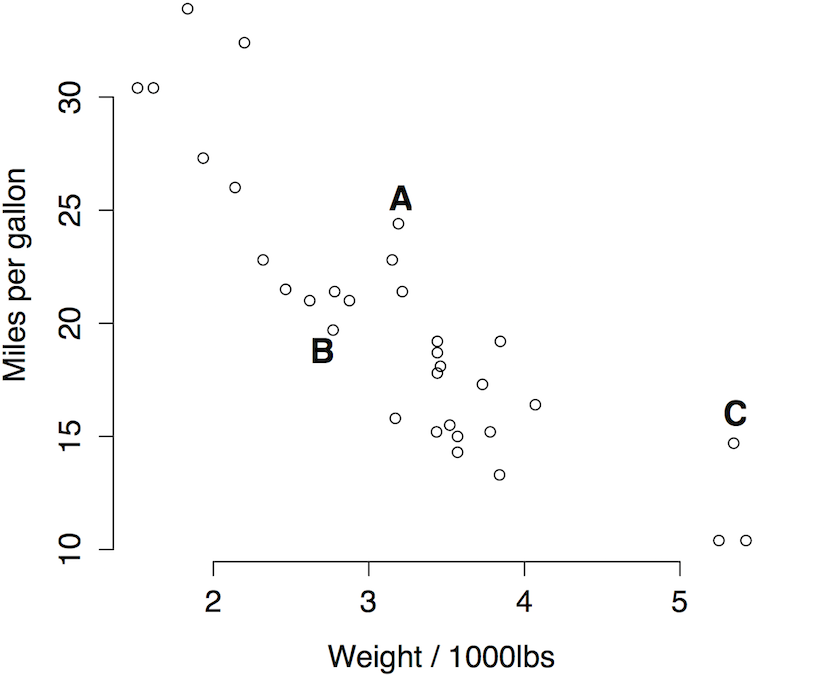
Questions
- Draw a straight-line model that best fits the data.
- For a vehicle weight of 3000 pounds, what is the approximate fitted value of your model?
- For data points A, B, and C, what are their (approximate) residuals under your model?
- Can you summarize your model by a few numbers?
- How might you estimate those numbers mathematically?
- Do all the observations in the plot have equal influence on the fitted model? If not, which have the most influence?