Birth weight classroom exercise
#Objective We are learning about probability. One point of emphasis is that probability works from a population to make statements about a sample, and that statistics works from a sample to make statements about a population.
The second question was designed to confront students with that difference. They all gave good answers, and one group really hit the nail on the head, saying that the key question is whether the difference between two categories in the sample is large enough (given the sample sizes) to make conclusions about the population.
#Exercise
Plots
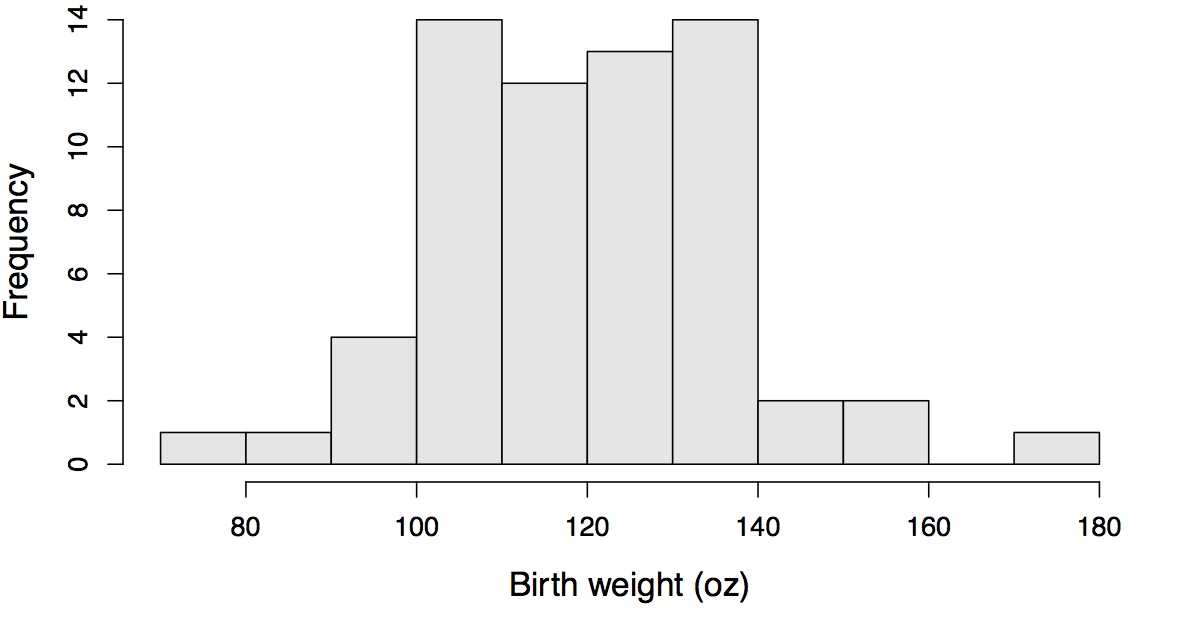
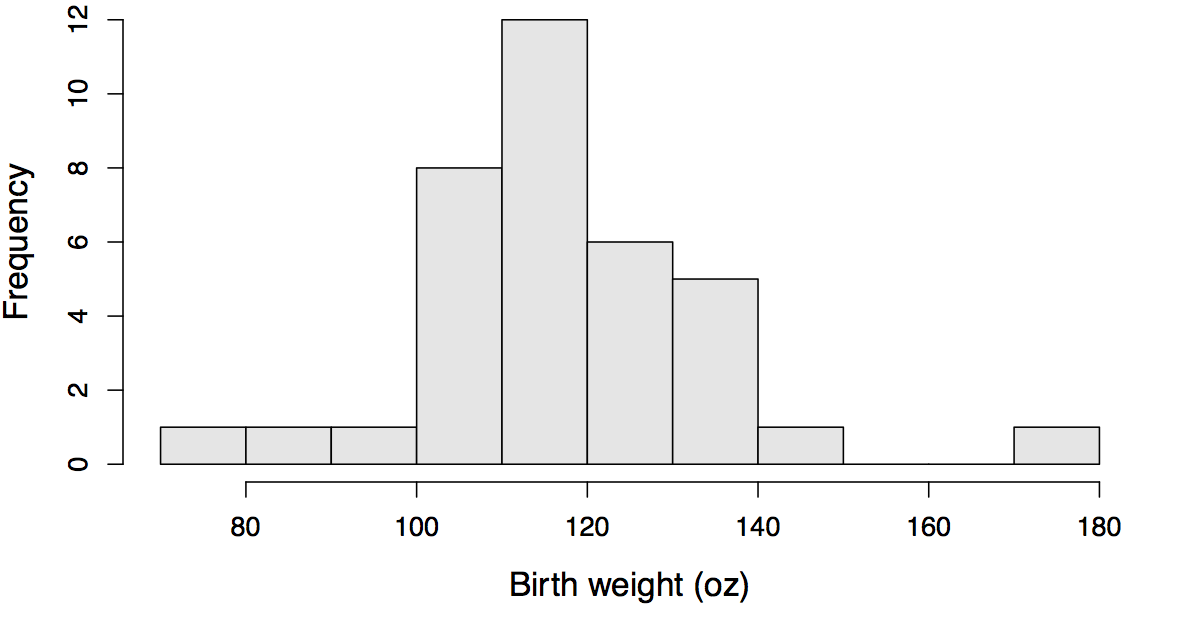
This exercise is based on a sample of 100 babies, chosen at random from the 1236 in the Childhood Health and Development Study, which measured babies born at Kaiser Foundation Hospital in Oakland between 1960 and 1967. First we have a histogram of the birth weights of first-born children (N=64), then a histogram of the birth weights of later children (N=36).
Data that are equal to a break in the histogram were put into the left-hand bin.
Histogram of birth weights for first children
Histogram of birth weights for later children
Question 1
-
If a baby is selected at random from among the first children, what is the probability that its birthweight was less than or equal to 120 ounces? Annotate the plot to show your calculation.
-
If a baby is selected at random from among the later children, what is the probability that its birthweight was less than or equal to 120 ounces? Annotate the plot to show your calculation.
Question 2
Among all children born at Kaiser Foundation Hospital, 1960-1967, do you think that the probability that a baby weighs less than 120 oz depends on whether or not it is first in birth order? Explain in about three sentences.